This post summarizes my logistics for debugging the default PyTorch compiler, TorchInductor.
1. Installation
1.1 Install Conda
wget https://repo.anaconda.com/miniconda/Miniconda3-latest-Linux-x86_64.sh
bash Miniconda3-latest-Linux-x86_64.sh
# Follow the promptions and install the miniconda.
conda create -n pt_compiled python=3.11
conda activate pytorch
You can download the miniconda installation script for your platform from https://docs.conda.io/en/latest/miniconda.html.
conda install -y magma-cuda121 cmake ninja mkl mkl-include libpng libjpeg-turbo graphviz -c pytorch
# Make sure you use the correct numpy version if you'd like to use TorchBench
# https://github.com/pytorch/benchmark/blob/main/requirements.txt
pip install numpy==1.23.5
1.2 Use Nightly PyTorch and Its Dependencies
pip3 install --pre torch torchvision torchaudio --index-url https://download.pytorch.org/whl/nightly/cu121

git clone https://github.com/pytorch/benchmark
cd benchmark
python3 install.py
1.3 Compiled From Source
For reference, see Pytorch源码编译.
I prefer the following folder structure:
.
├── audio
├── benchmark
├── data
├── logs   # created by myself
├── ml_scripts # cloned from https://github.com/FindHao/ml_scripts
├── pytorch
├── text
└── vision
2. Testing Installation
If you installed PyTorch from source, you can use the benchmarks in the source code folder. Run the following command to test the installation of PyTorch compiler.
cd pytorch
python benchmarks/dynamo/huggingface.py  --performance -dcuda --inference --inductor  --only BartForCausalLM
The output is as follows.
loading model: 0it [00:03, ?it/s]
cuda eval  BartForCausalLM
running benchmark: 100%|██████████████████████████████████████████████████████████████████████████████████████████████| 30/30 [00:01<00:00, 22.01it/s]
1.352x
There are multiple model collections(benchmark suites) you can use, such as torchbench.py, huggingface.py, and timm_models.py.
Read Dynamo Benchmarks for more information.
3. Debugging
There are some debug flags you can set to obtain debugging information. The common flags I used are
TORCH_COMPILE_DEBUG=1 INDUCTOR_POST_FUSION_SVG=1 TORCH_LOGS="inductor,dynamo" INDUCTOR_TEST_DISABLE_FRESH_CACHE=1 python benchmarks/dynamo/huggingface.py --performance -dcuda --inference --inductor --only BartForCausalLM
Check more environment flags in config.py.
The terminal output shows a lot of information, and debugging files are generated in pytorch/benchmarks/dynamo/torch_compile_debug. The folder name follows the rule run_date_time-pid_XX.
The following is the example structure of a test run.
.
├── torchdynamo
│   └── debug.log
└── torchinductor
    ├── aot_resnet18___0_debug.log
    └── resnet18__0_inference_0.0
        ├── fx_graph_readable.py
        ├── fx_graph_runnable.py
        ├── fx_graph_transformed.py
        ├── ir_post_fusion.txt
        ├── ir_pre_fusion.txt
        └── output_code.py
The output_code.py is the final compiled code! It contains the compiled triton kernels and wrapper code , so you can directly run it for testing! fx_graph_* shows the fx graphs generated after graph lowering, and ir_*.txt are TorchInductor IR pre- and post- operation fusions.
3.1 Debug Using VSCode
I usually debug torchinductor via VSCode. For me, GUI debugging is easier and faster than using the terminal. Here are the steps to debug torchinductor via VSCode.
First, install python extension in VSCode. It provides the python debugger.
Second, create launch.json file from the sidebar/Run and Debug/create a launch.json file. Here is an example file:
{
    // Use IntelliSense to learn about possible attributes.
    // Hover to view descriptions of existing attributes.
    // For more information, visit: https://go.microsoft.com/fwlink/?linkid=830387
    "version": "0.2.0",
    "configurations": [
        {
            "name": "resnet18",
            "type": "debugpy",
            "request": "launch",
            "program": "/scratch/yhao/p9/pytorch/benchmarks/dynamo/torchbench.py",
            "console": "integratedTerminal",
            "justMyCode": false,
            // if you are debuging torchrun program
            // "subProcess": true,
            // "redirectOutput": true,
            "args": [
                "--performance",
                "--amp",
                "-dcuda",
                "--inference",
                "--inductor",
                "--disable-cudagraphs",
                "--only",
                "resnet18",
            ],
            "env": {
                "TORCH_COMPILE_DEBUG": "1",
                "INDUCTOR_POST_FUSION_SVG": "1",
                // "CUDA_VISIBLE_DEVICES": "2",
                // "INDUCTOR_WRITE_SCHEDULER_GRAPH": "1",
                "TORCHINDUCTOR_MULTIPLE_STREAMS": "1",
            }
        },
}
After creating a launch.json, the Run and Debug will automatically show the testing configs you added in this file. Add a breakpoint in this line
This function is a key point can help you understand how and what TorchInductor do.
The following screenshot shows an example of how VSCode debugging looks like.
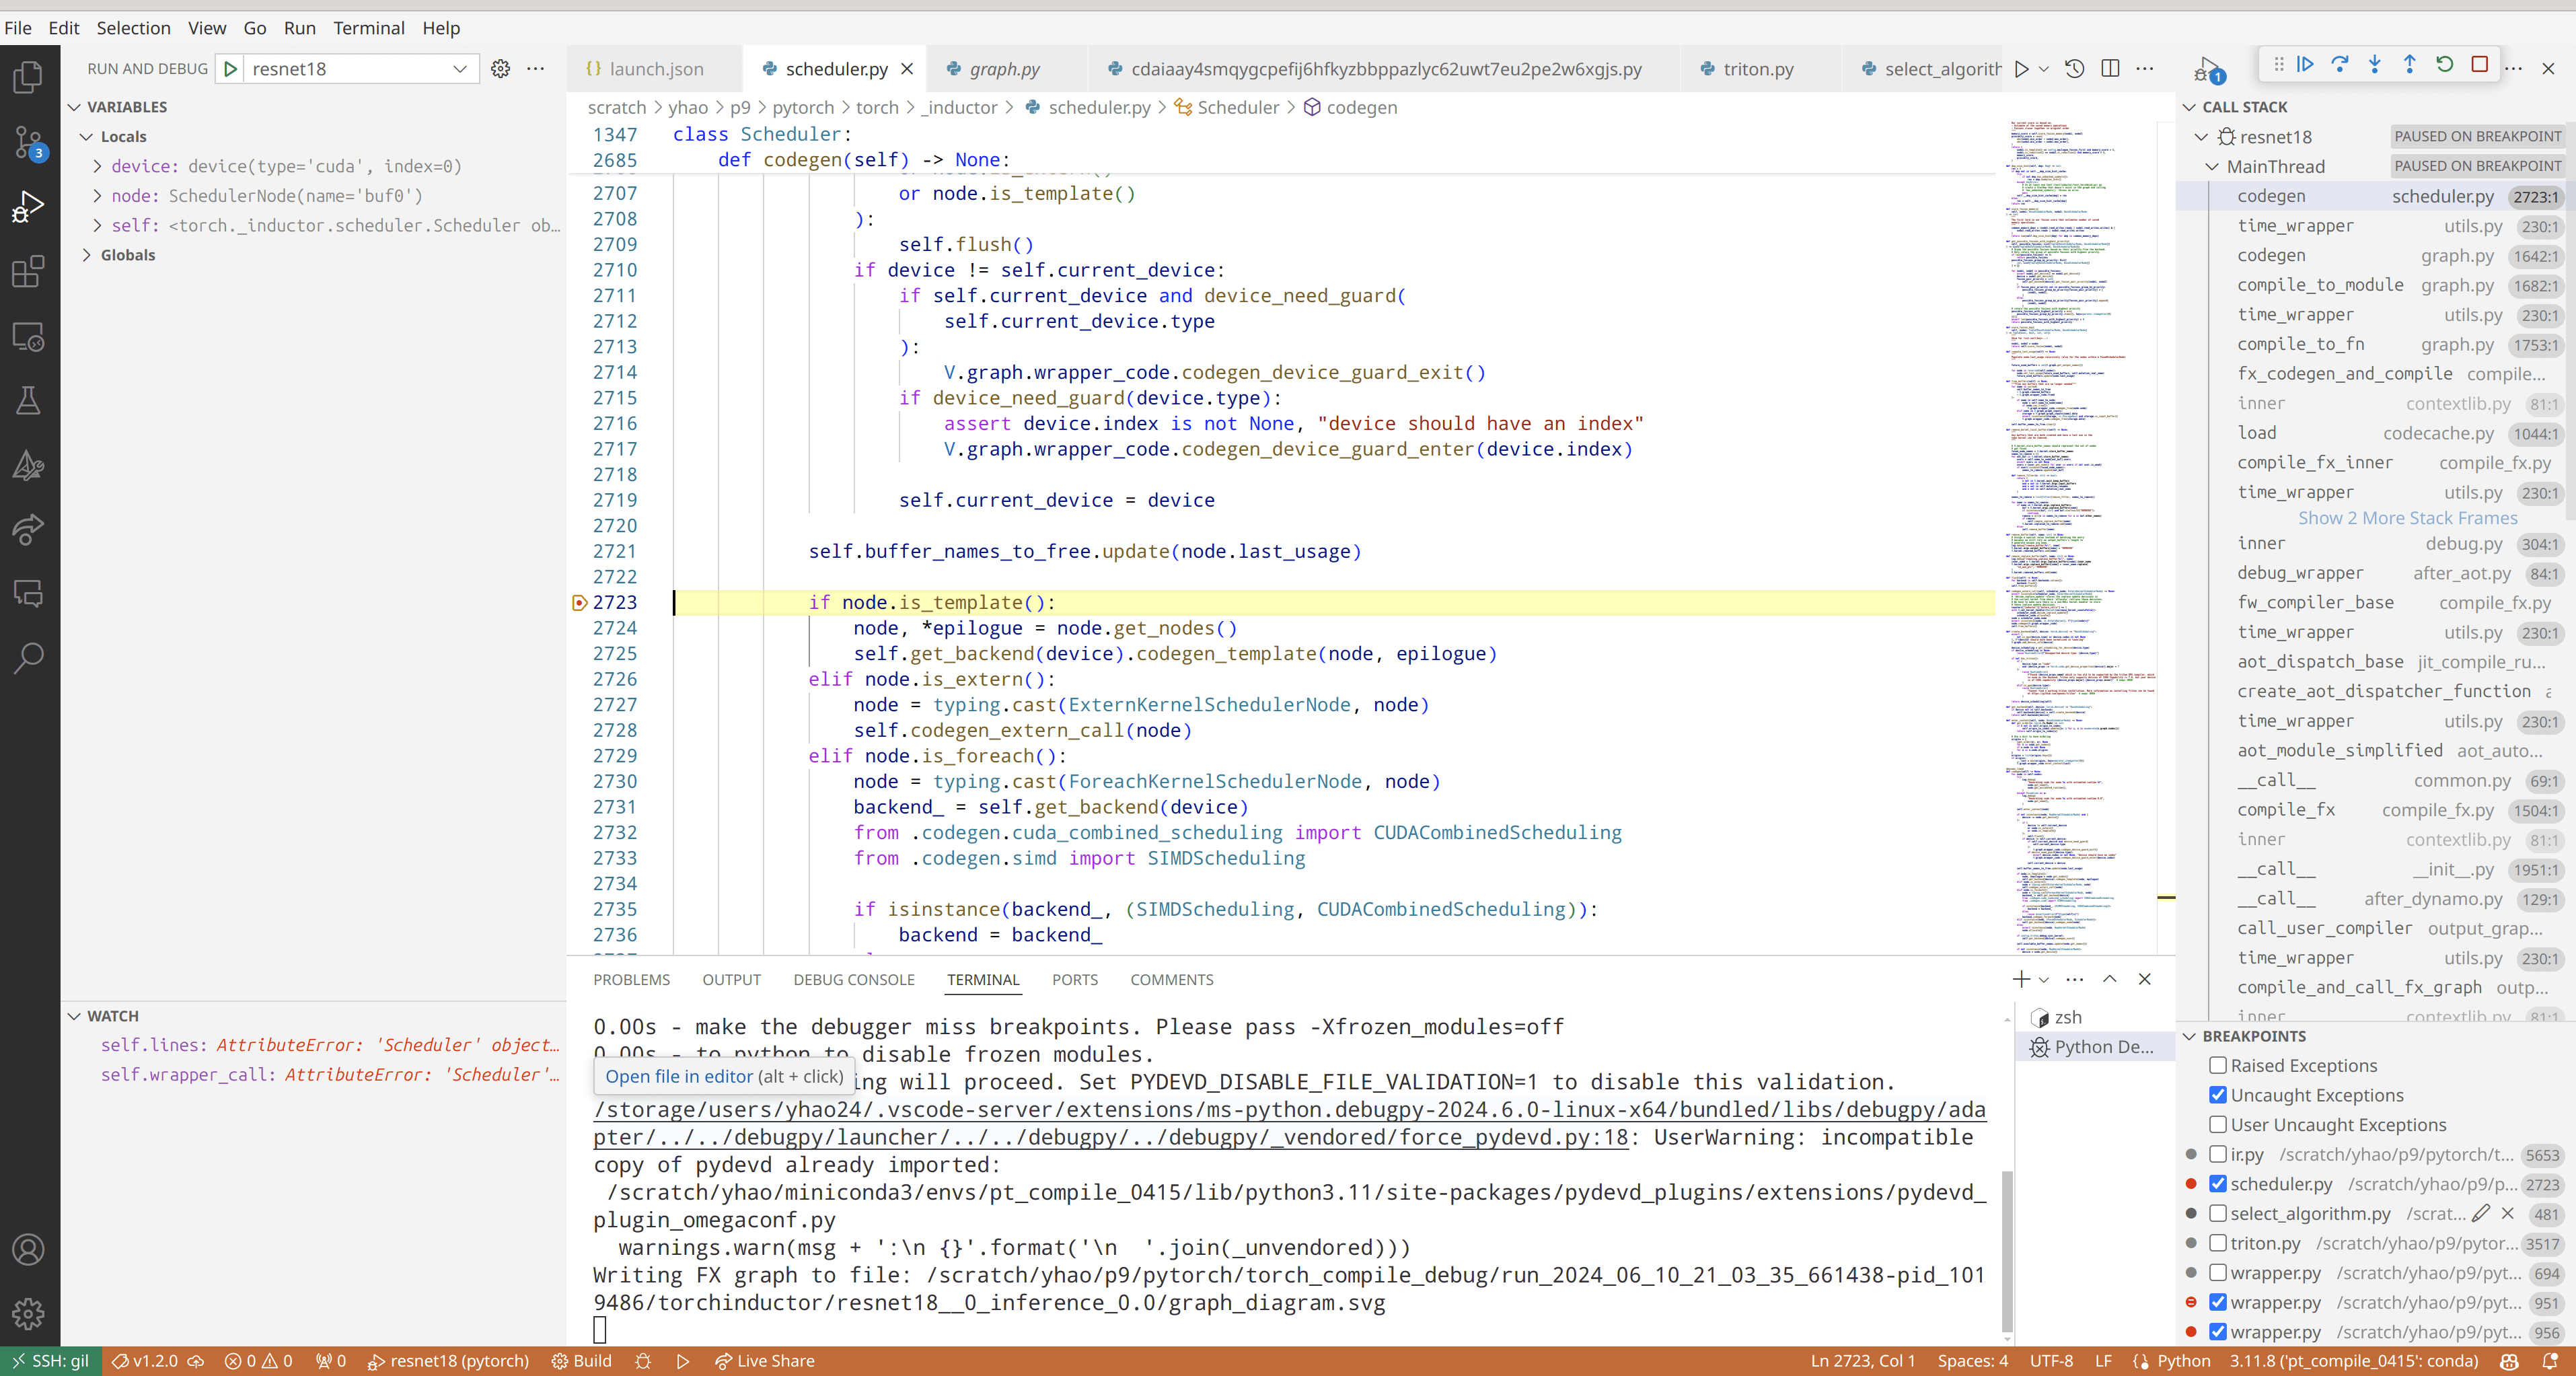
I enabled the secondary sidebar in VSCode and placed the call stack and breakpoints there. The left sidebar includes the local/global variables, and you can add your own variables to watch.
You can use shortcuts like Step Into and Step Over to debug your PyTorch models with TorchInductor enabled. Check the menu bar/Run to see their shortcuts.
Comments